
Our launched Enterprise Data Scientist on the Snowflake Marketplace
Our AI Agent autonomously uncovers trends, patterns, and seasonality in data, delivering natural-language forecasts, performance monitoring, and anomaly detection – fully automated and future-ready.
The AI Agent instantly reveals frequencies, variability, and outliers, translating raw distributions into clear, expert-level insights. Patterns emerge automatically, empowering faster, smarter decisions.
Detailed EDA Interpretation
Only the POSTAL_CODE column contains missing values (41,296 entries)
This represents approximately 80.5% of all records, which is significant
For classification tasks, this feature may need to be dropped or imputed
Mean sales: 246.49 (high standard deviation: 487.57)
Highly skewed distribution (75% of sales below $251.05)
Potential outliers in upper range require investigation
Quantity: 1 – 14 units per order
Average quantity: 3.48 items (std: 2.28)
Discounts: 0% – 85%
Median discount: 0%, indicating many orders have no discount
Negative profits observed (min: -6,599.98)
Maximum profit: 8,399.98
Shipping cost range: 1.00 – 933.57
Mean shipping cost: 26.48
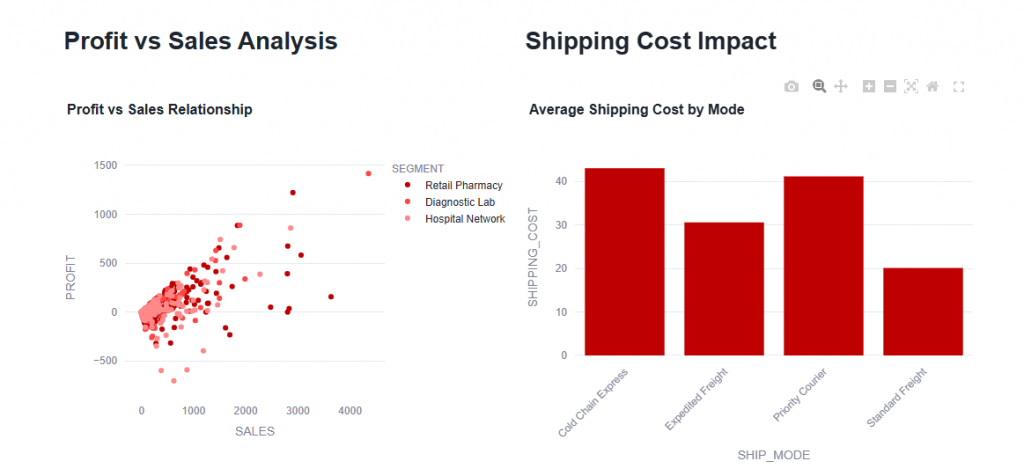
Strong Positive Correlations
Sales & Shipping Cost (ρ=0.909, r=0.768)
Higher value orders incur higher shipping costs
Profit & Sales (ρ=0.490, r=0.485)
Higher sales generally lead to higher profits
Notable Negative Correlations
Discount & Profit (ρ=-0.596, r=-0.316)
Higher discounts reduce profitability
Discount & Sales (ρ=-0.100, r=-0.087)
Minimal impact of discounts on sales volume
Order Priority
Medium priority: 57.39%
High priority: 30.22%
Critical: 7.67%, Low: 4.73%
Product Categories
Office Supplies: 61%
Technology: ~19%
Furniture: ~20%
Sub-Categories
Top 5 sub-categories = ~45% of orders
Binders: 11.98%, Storage: 9.84%
Other sub-categories evenly distributed
Address missing POSTAL_CODE values
Feature engineer based on strong correlations
Manage class imbalance in categorical variables
Handle outliers in sales and profit
Normalize numerical features due to varying scales